
Polkadot (DOT): Slow growth, where is the point of breakthrough?
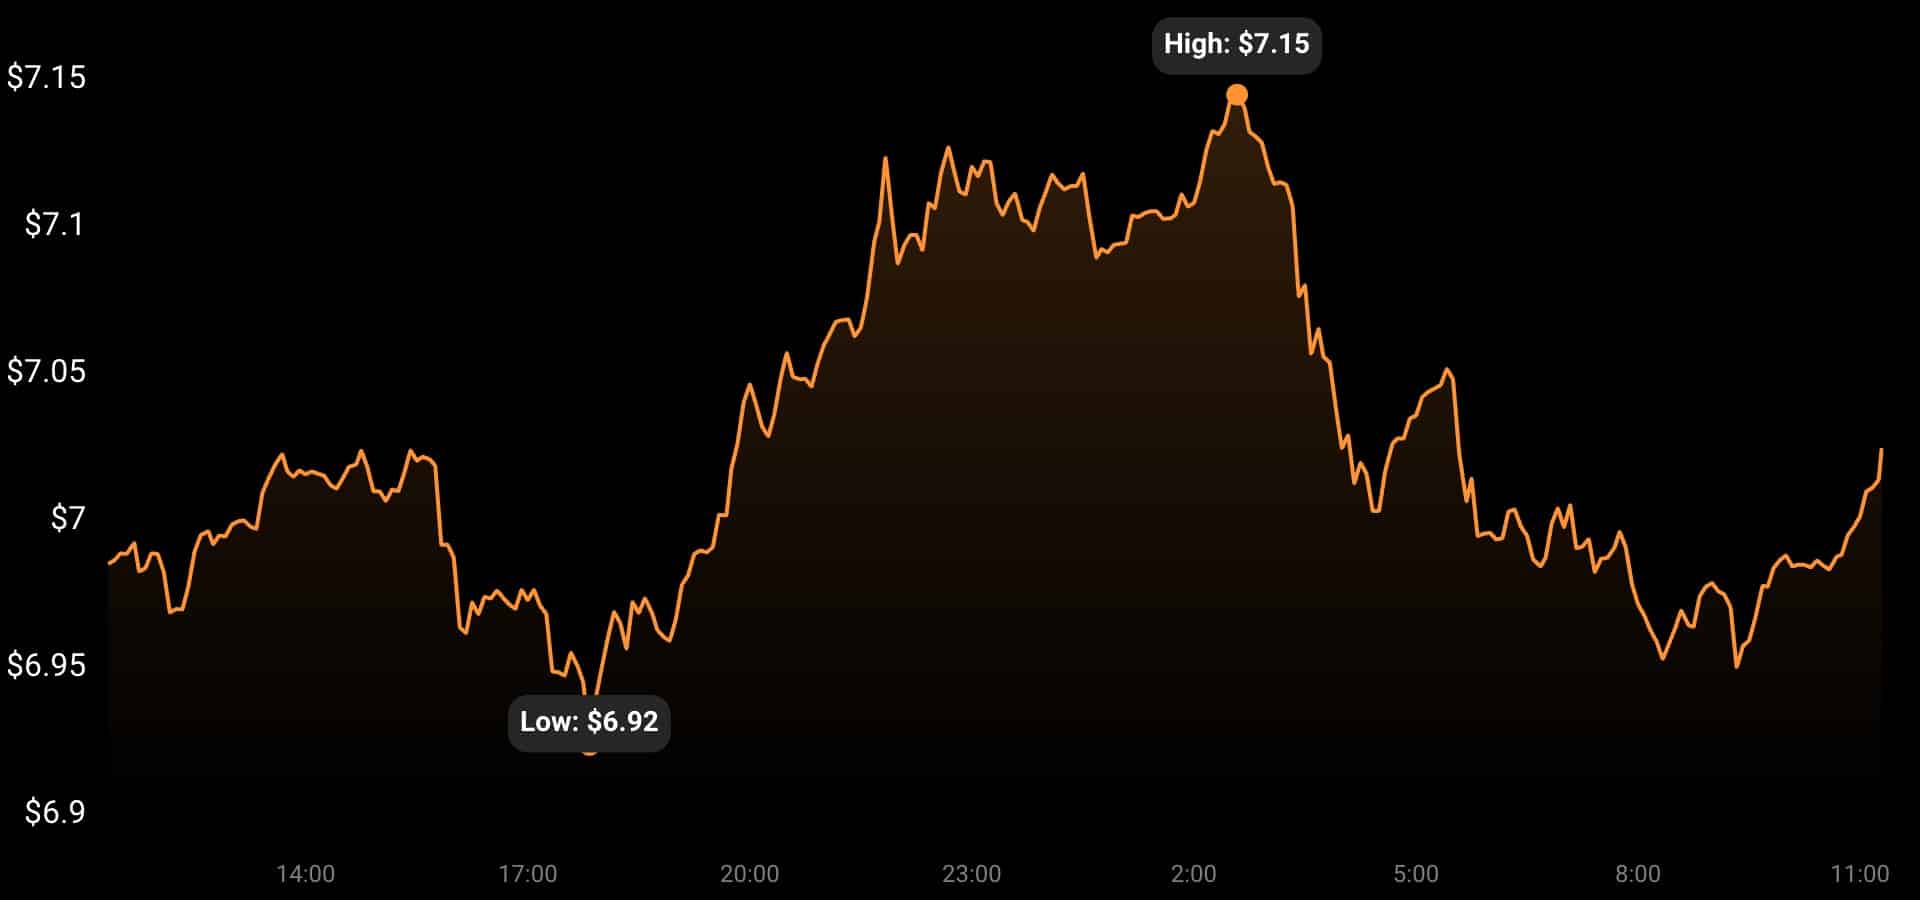
DOT's performance last week was quite slow when it dropped nearly 10% after only 7 days. In fact, while some positive developments that could potentially boost the price of altcoins have occurred, not everything has gone according to plan. At the time of writing, DOT is trading at $7.03 with a market cap of $7.8 billion.
What's happening?
Recently, Scallop, a popular cryptocurrency exchange, mentioned in a tweet that DOT is among the three most popular coins on their platform. This seems to be a positive development as it reflects the popularity of the coin. The other two altcoins that made the list are MATIC and BNB.
Furthermore, CoinEX Global also named Polkadot as one of the top 5 financial income cryptocurrencies, adding value to the blockchain.
In conclusion, although this altcoin has received recognition from various players in the crypto market, its social position is still quite stagnant. This is also quite obvious when looking at the Santiment rankings.

Interestingly, when the price of DOT fell on the charts, a massive increase in its developer activity occurred. This is unusual as an increase in developer activity is generally a positive sign for a blockchain. The fact that developers have been working hard to improve blockchain is also supported by a recent interview from the co-founder of Polkadot.
The co-founder recently stated,
“The crypto space, especially in terms of technology, is still quite early. We've embraced the idea that it's time for less testing than standardization.”
Needless to say, the executives' statements are in line with Polkadot's chain updates and developments.
The way forward will be...
The DOT daily chart also does not share a clear picture of what will happen in the coming days as some market indicators are falling while others are up.
For example, the exponential moving average (EMA) ribbon reveals that the bears have the advantage in the market because the 20-day EMA is below the 55-day EMA. Furthermore, the MACD is also showing a bearish crossover, minimizing the chances of a breakout north in the short term.
However, the Chaikin Money Flow Index and the Relative Strength Index are both bullish, offering some hope of near-term upside.

Sep 18, 2022
 Price Ahead, According to Plan B")


 and Fetch.ai (FET) Rally Predictions, Gaming Altcoin Focus Areas")


 Rally Indicator Turns Bullish, Predicts 118% Surge: Top Crypto Analyst's Insights")


