
Should NEAR holders take profits or continue? See more analysis below
Listen to this article
NEAR Protocol announced on Twitter that it has partnered with Google Cloud. According to the official statement, the partnership was established so that network developers who have received funding can easily create and deploy Web3 projects and decentralized applications (dApps). Now, you ask, how has the market reacted to this new partnership?
NEAR announcement effect
The announcement could have had a favorable effect on price action, as seen in the daily timeframe. According to the chart, the price NEARLY increased by more than 2% between the opening and closing prices on October 5.
Shares opened at $3,623 and ended at $3,696. Furthermore, a high of $2,729 was seen during the same time period. As for the volume indicator, the number of trades during this period is pretty close to eight million. This is the highest level since early October.
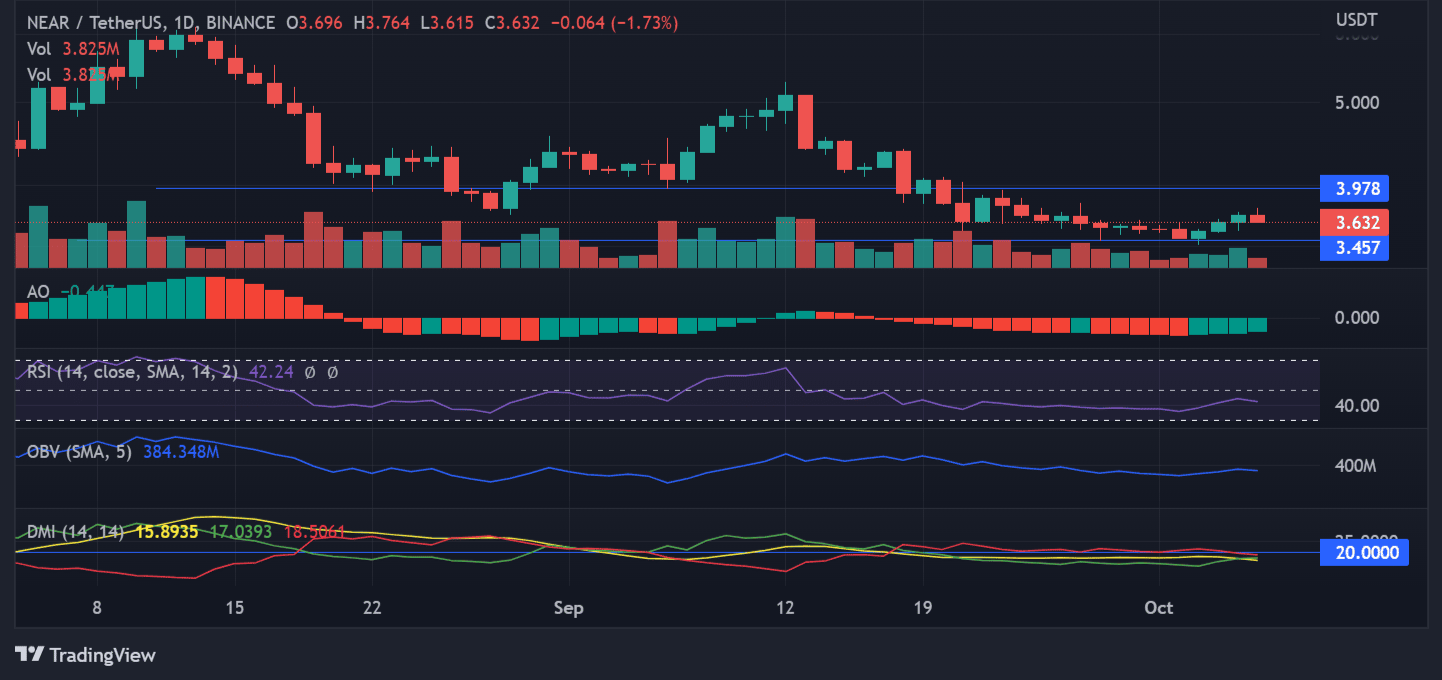
There have been some tests near the $3.45 support on the daily time frame and there is resistance at the $3,978 price area. Apart from the spike in price, there has been no discernible price movement in the past.
As a result, the price action on the daily timeframe appears to have been flat for the past few weeks.
Looking at the chart shows a line just below the neutral point on the relative strength index indicator. This is a sign of a downtrend, but not a particularly strong one. This amount can also be obtained from the Awesome Oscillator indicator on the daily timeframe.
NEAR weekly price chart movements
Looking at NEAR's price action on the weekly time frame, we can see that after experiencing a downtrend from around May to June, it has been trading sideways ever since.
The weekly chart reveals that the $3,722 area is supported but being tested. If this level does not provide support, a new level may be formed.
Resistance indicators have been spotted at the $6,237 area, with no potential test in sight. Weekly gains above 5% are also plotted on the chart.

Statistics obtained from DefiLlama show that in the past 24 hours, the platform has seen a 0.26 percentage point increase in Total Value Locked (TVL).
The information obtained also revealed that TVL has exceeded $270 million, down from more than $400 million collected in June.
Likely, the drop in TVL could be due to a bear market. TVL can also increase as more projects are submitted on the network.

The $3.7 price area on the weekly time frame seems to be the nearest resistance point. In the short term, a break of this level could imply an uptrend and possibly a challenge to the $3.9 resistance area.
Various initiatives with unique capabilities will be launched on the network thanks to financial incentives and cooperation with Google Cloud. Therefore, this could have a positive effect on the price of the alternative, and long-term holders could smile again.
Oct 07, 2022

 Rally Indicator Turns Bullish, Predicts 118% Surge: Top Crypto Analyst's Insights")


 Price Ahead, According to Plan B")
 Wallet Suddenly Becomes Active")


-400-400.webp "XRP Shows Tentative Bullish Trend: Can It Overcome Bearish Pressure?")


 and Fetch.ai (FET) Rally Predictions, Gaming Altcoin Focus Areas")


